What is Uncertainty in Measurement?
What Is Uncertainty in Measurement?
Uncertainty is a parameter associated with the result of a measurement that defines the dispersion of probable measurement values. In other words, it communicates the level of confidence for which the true value of a measurement is within a defined range.
Uncertainty can also be thought of as a mathematical combination of all sources of error associated with a measurement.
How Is the Uncertainty Value Calculated?
Uncertainty is calculated by combining two types of parameters, Type A and Type B values. These values make up all sources of error associated with a measurement. Type A values can be calculated using statistics. For example, taking 10 measurements and calculating the standard deviation of those measurements would be a Type A value. Type B values cannot be calculated, and reference to literature is needed to provide a value. For example, a ruler with 0.1 cm increment marks has a 0.05 cm resolution, and that resolution is a Type B value.
So, the contributions of uncertainty are all the Type A and Type B values associated with the measurement of interest. Every measurement will have different uncertainty contributions, and every lab will calculate uncertainty a little differently. However, some general contributors should be considered in almost every uncertainty budget. Here is a list of general contributors to uncertainty:
The best way to organize the contributors to uncertainty is with an uncertainty budget. See the example below:
| Source | Type | Divisor | Units |
| Repeatability | A | 1 | lbs |
| Reproducibility | A | 1 | lbs |
| Std Tolerance | B | 1.73 | lbs |
| Resolution | B | 2 | lbs |
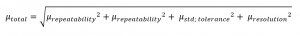
The overall uncertainty of measurement is then a combination (root mean square) of the individual sources of uncertainty. For the uncertainty budget example above, the equation would be:
Simple Example of Calculating Uncertainty
Imagine you are weighing an elephant on a truck balance with a 10 lb. resolution. Let’s take the following steps to calculate the uncertainty associated with weight measurement.
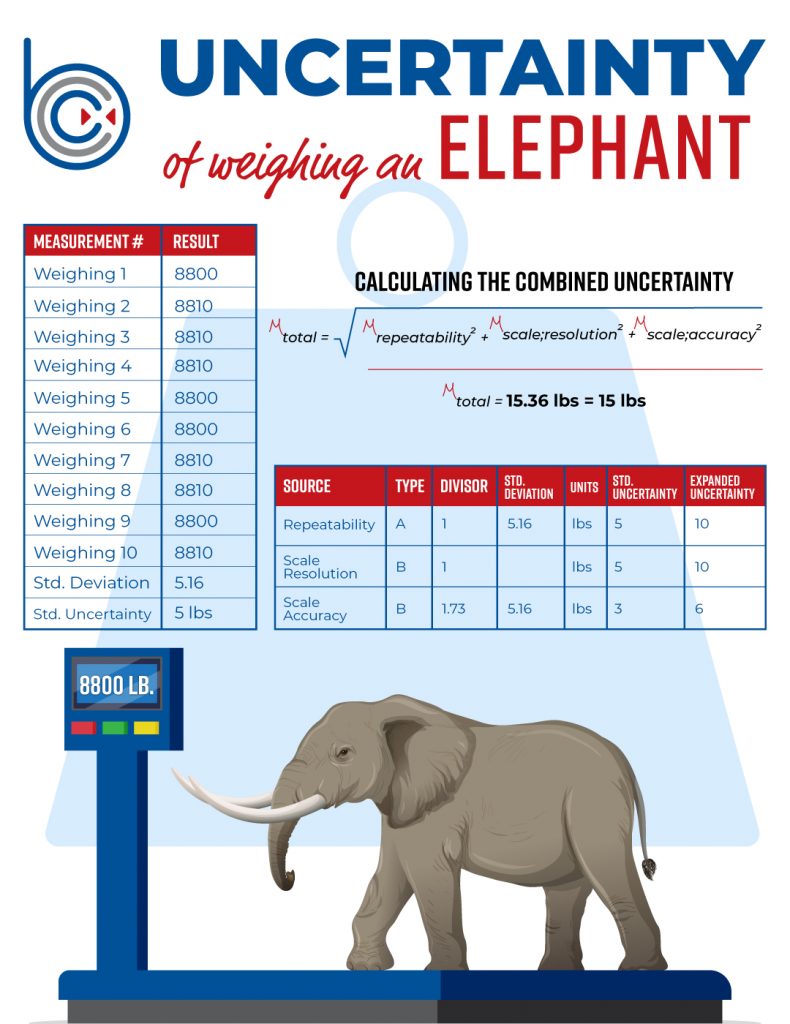
| Measurement # | Result |
| Trial 1 | 8800 |
| Trial 2 | 8810 |
| Trial 3 | 8810 |
| Trial 4 | 8810 |
| Trial 5 | 8800 |
| Trial 6 | 8800 |
| Trial 7 | 8810 |
| Trial 8 | 8810 |
| Trial 9 | 8800 |
| Trial 10 | 8810 |
| Standard Deviation | 5.16 |
| Standard Uncertainty (repeatability) | 5 lbs |
Notice that the resolution of 10 lbs. affects the uncertainty of this measurement. The reason is that the scale does not have the capability to measure between 8800 and 8810 lbs. The results show nearly half the measurements at each weight, meaning that the true value of the elephant’s weight could be anywhere in the range of the resolution restriction.
The resolution of the scale is 10 lbs. The resolution uncertainty is calculated by dividing this by 2. So, the uncertainty associated with resolution is 5 lbs.
Note: there are different ways of calculating resolution uncertainty. This depends on which probability distribution applies to the parameter. This will not be covered in this example.
| Source | Type | Divisor | Standard Deviation | Units | Standard Uncertainty | Expanded Uncertainty |
| Repeatability | A | 1 | 5.16 | lbs | 5 | 10 |
| Scale Resolution | B | 1 | lbs | 5 | 10 | |
| Scale Accuracy | B | 1.73 | 5.16 | lbs | 3 | 6 |
Calculating the uncertainty is simply taking the root mean square of all the individual uncertainty contributions.
In the example above, the equation will look like this:
![]()
So, the calculated uncertainty is 15 lbs, meaning the elephant weighs 8806 (average weight of all 10 measurements) ± 15 lbs.
How Does Uncertainty Measurement Relate to Pipette Calibration?
No matter what the measurement is, uncertainty plays an important part in communicating how the reported measurement results are related to the true value of those measurements. It’s no different in pipette calibrations, as the uncertainty value demonstrates how close the measured amount of liquid is to the value of the setting used on the pipette.
For example, if you have an uncertainty of ±0.5% associated with a 1 ml pipette, it is known that the amount of liquid that you draw will be 1ml ± 0.5% (or anywhere in the range of xml – xml).
Pipette Calibration – Equipment and Methods
Calibration of pipettes requires an analytical balance to weigh the water, a barometer to measure air pressure in the lab, a thermometer to measure the temperature of the lab, and x. Each piece of equipment contributes to the uncertainty in the measurement taken by the pipette. They may not all equally contribute to the uncertainty, but they all play a role.
There are also human error considerations when calibrating pipettes. A technique in which the lab technician uses a pipette is a major contributor to the uncertainty of a pipette’s measurement. Recall that, when calculating the uncertainty, a standard deviation of a set of measurements is used as the repeatability contribution to uncertainty. This means that it is especially important for the technician to have proper and consistent technique.
Example Pipette Uncertainty Budget
| Source | Type | Units |
| Repeatability | A | µL |
| Balance Tolerance | B | µL |
| Balance Resolution | B | µL |
| Thermometer Tolerance | B | µL |
| Reproducibility | A | µL |
Common Challenges When Implementing Uncertainty
One of the major challenges in calculating uncertainty is obtaining Type A data. In almost all cases, Type A data consists of a series of 10 measurements at each measurement range that is going to be reported. For example, if you have an instrument that has 10 sets of measurement ranges, that would be 100 sets of measurements to record to calculate the repeatability for each range. This can be expensive and time-consuming.
Strategies for Reducing Uncertainty in Pipette Calibrations
One way to reduce uncertainty in pipette calibrations is to use the best equipment. For example, the design of the pipette itself will contribute to the repeatability contributor. Having a good design will decrease the deviation of measurement results. Another way to reduce the uncertainty in pipette calibrations is to invest in an analytical balance that has the best sensitivity and accuracy.
In addition, training and competency of technicians performing measurements are major contributors to the repeatability of the results. Technicians must use consistent and proper techniques to take measurements with the least amount of error.
Best Practices for Uncertainty Management
A lab should have a Quality Management System that requires good documentation and record-keeping practices. This is relevant to uncertainty because these practices will ensure that information like equipment status (in/out of tolerance, calibration due dates) is always known. It’s also good to put in place routine continuous improvement tasks such as internal audits, corrective actions, preventative actions, and management reviews. These processes will help improve operations and catch potential non-conformances before they happen.
Conclusion
In conclusion, it’s important to understand the effects of uncertainty value on the pipette calibration certificate on measurement expectations. It is important to have confidence in the lab that is calibrating your pipettes. After all, they are assigning the value of the uncertainty associated with your future pipette measurements.
Do you know if all the pipettes in your lab have up-to-date calibration certificates? Bio Calibration Company can calibrate your pipettes and reduce uncertainty associated with the measurements.
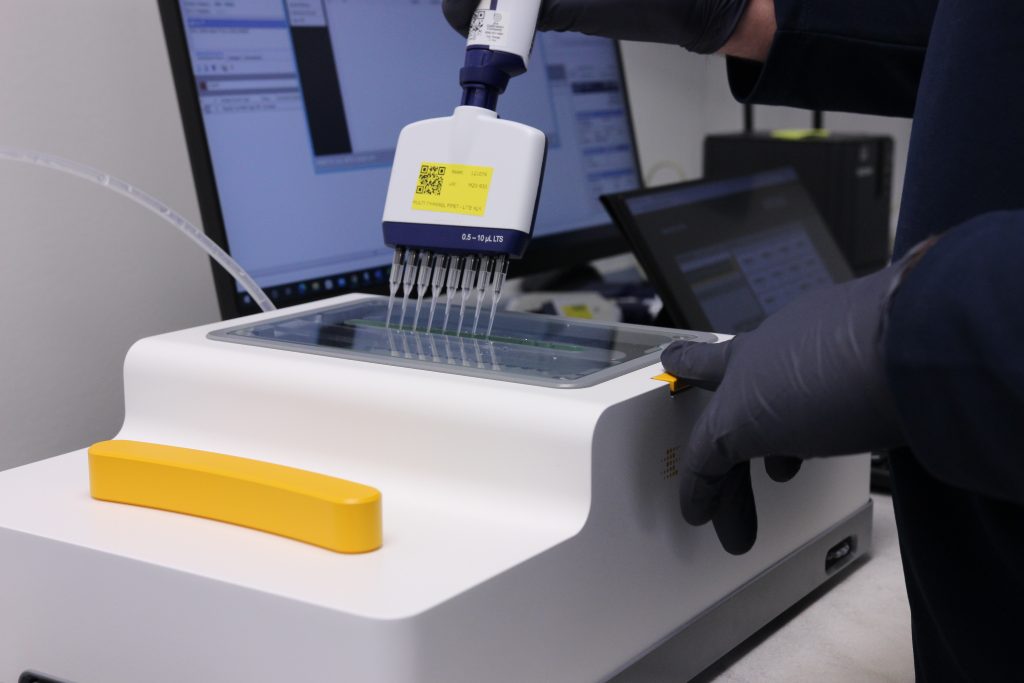
Bio Calibration Company is focused on reducing uncertainty while improving turnaround time when calibrating your pipettes. The speed cal helps make this possible, which allows technicians to work more efficiently since they can take multiple sample weights at one time. See image below.