

Oftentimes, getting a calibration certificate is all we are looking for in a calibration provider. We are rarely asked about the uncertainty calculation or which contributors are included in the total estimated uncertainty. Yes, the auditor at the accreditation company will always ask about the uncertainty budgets and make sure the minimum requirements are met. But why don’t customers ask about this more often? Maybe it’s because they aren’t sure why it’s important. This guide is designed to educate those seeking to understand the uncertainty value reported on certificates. This paper will help someone understand the general process for creating uncertainty budgets and using them to estimate the uncertainty at the time of calibration.
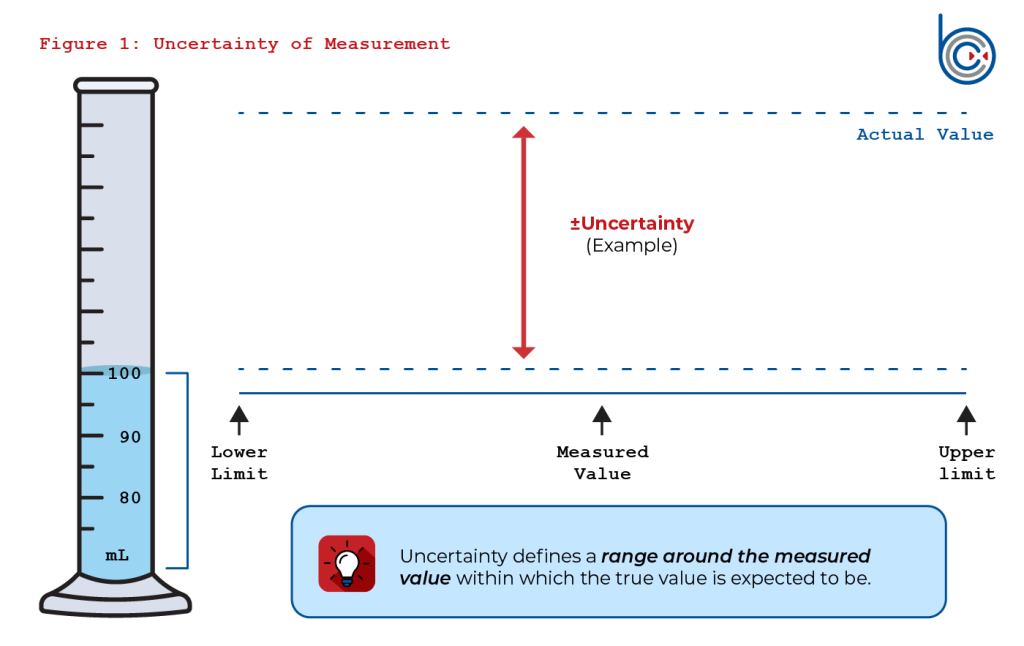
Uncertainty of measurement is defined as a parameter associated with the result of a measurement that characterizes the dispersion of values that could reasonably be attributed to the measurand. In simpler terms, it quantifies the doubt that exists about the result of a measurement. This doubt can arise from various sources, including the instruments used, the environment, the operator, and the measurement method itself. The uncertainty budget is what will be used to detail each of these sources and quantify them. We will discuss this later.
Here is an example of what measurement uncertainty would look like in terms of volume in the image below.
Understanding and quantifying this uncertainty is crucial for several reasons:
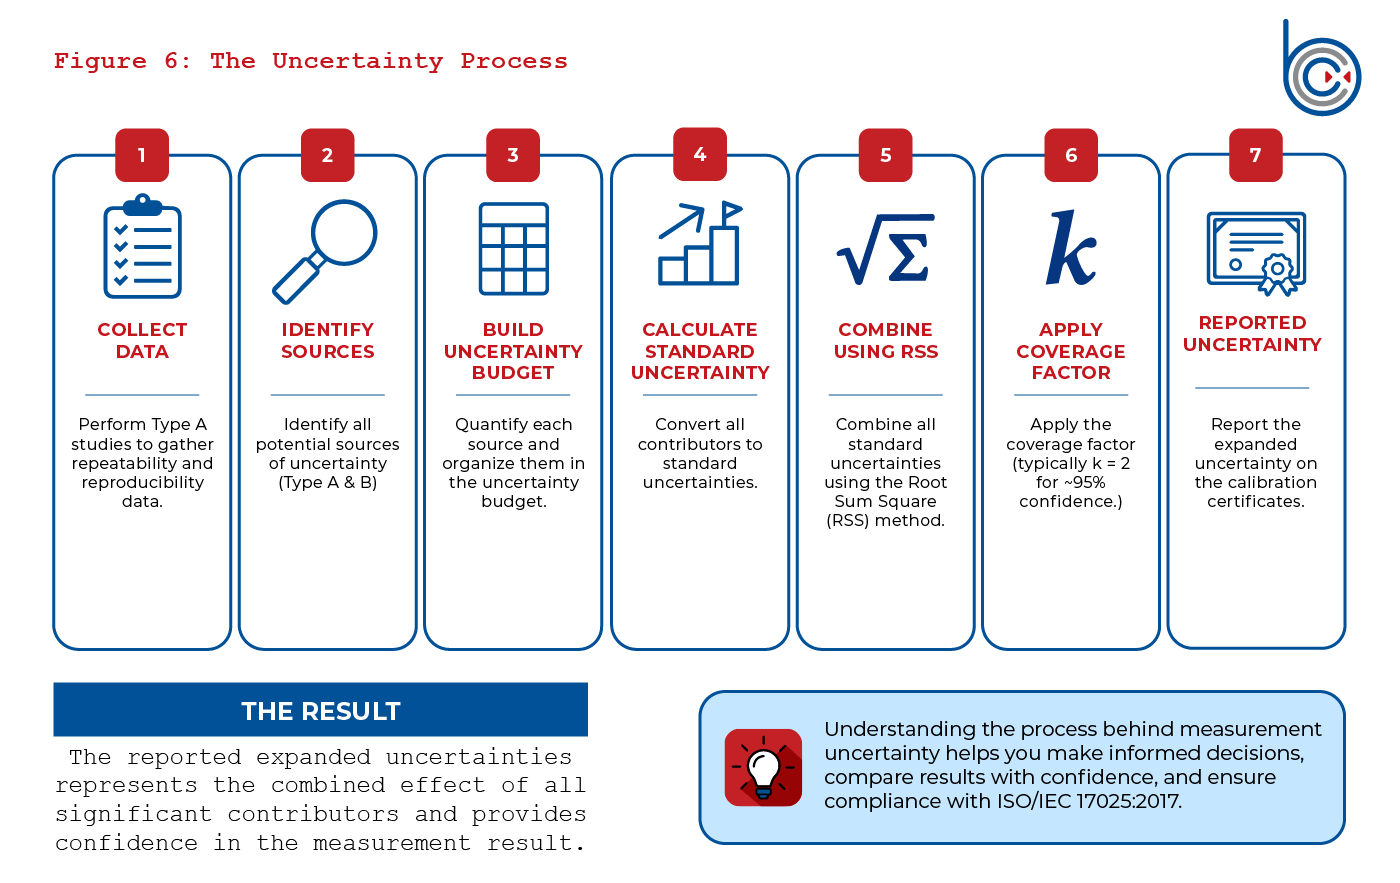
Before we dive into calculating uncertainty using an uncertainty budget, let’s take a look at the process as a whole. There are three main steps involved with uncertainty calculation that include:
In this step, we will review best practices for collecting data on repeatability and reproducibility. But first, let’s define what these two types of data are.
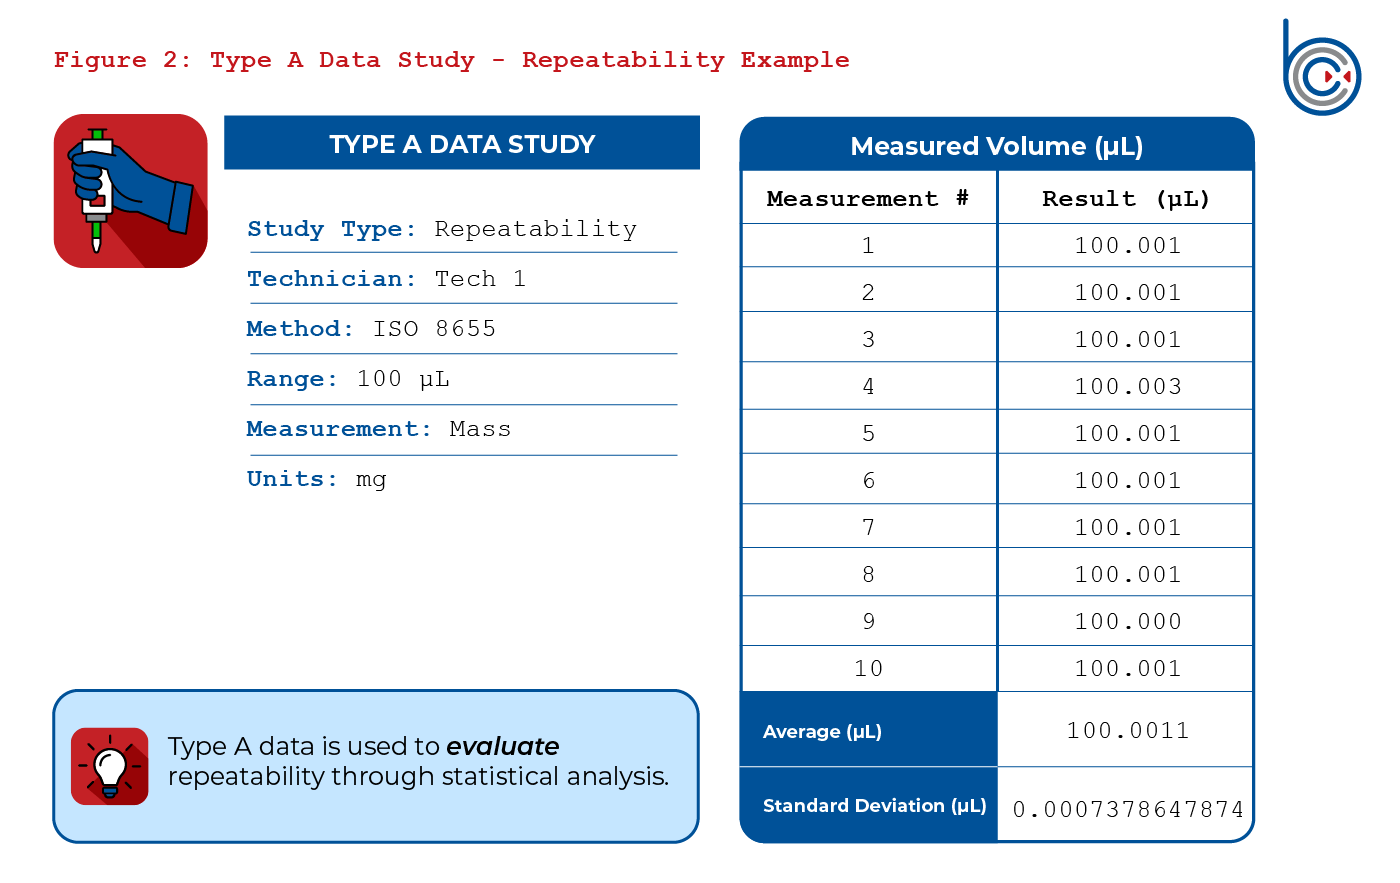
Repeatability – is the amount of deviation between individual measurements in a measurement set, usually quantified by the standard deviation of the measurements. Repeatability data will indicate to the lab how repeatable the measurements within a method are.
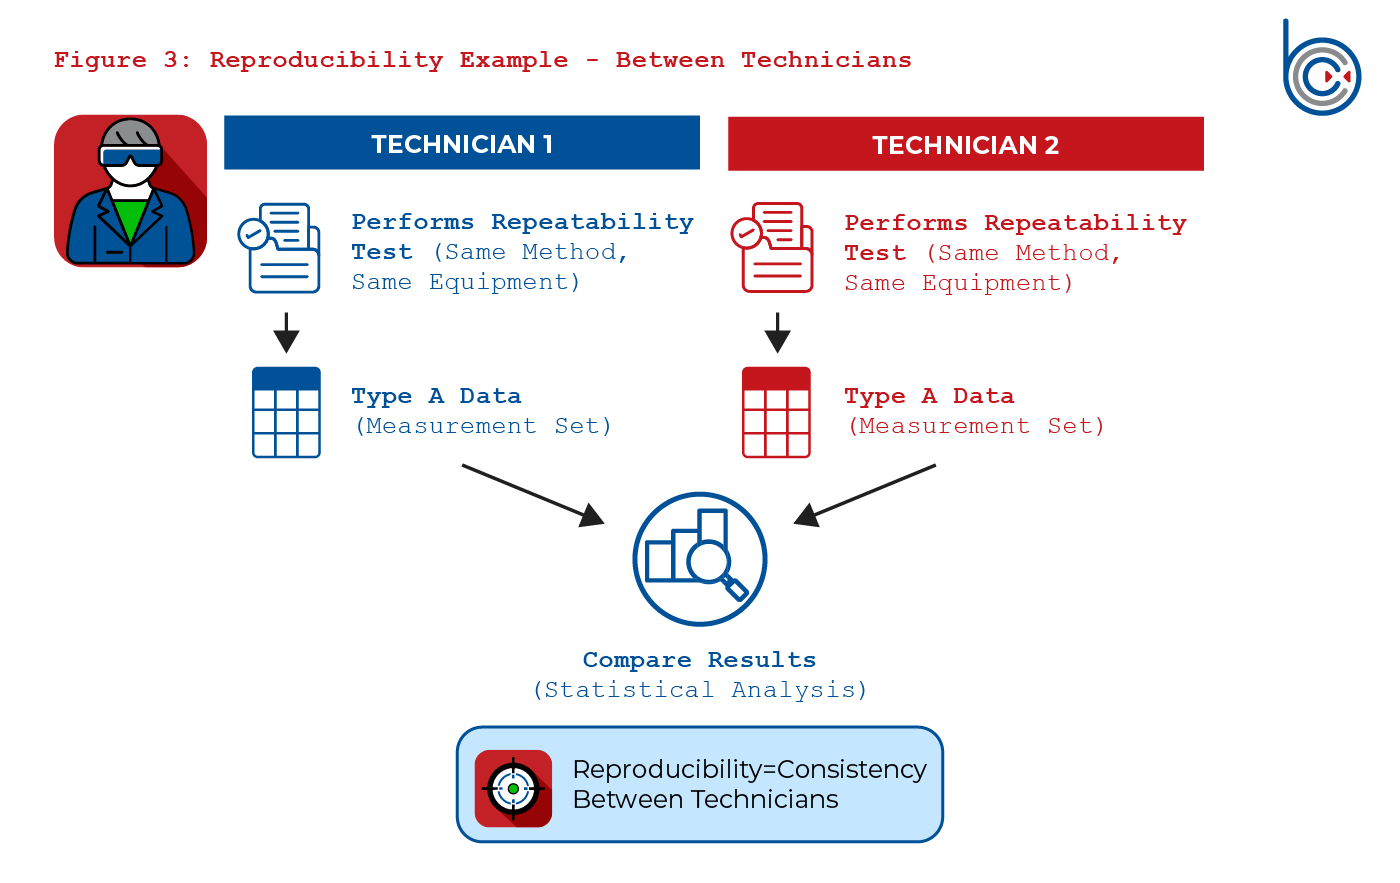
Reproducibility: is the amount of deviation between two different measurement sets when one or more variables are changed between sets. For example, one common way to measure reproducibility between measurement sets is to have a technician perform a repeatability test (which will have its own standard deviation), and then have a different technician perform the same test with the same equipment setup (which will have another standard deviation). Reproducibility is the comparison of variances and standard deviations across the resulting data sets.
Now that we know what reproducibility and repeatability are, let’s look at how we’ll measure them. A typical term for data collected in repeatability and reproducibility experiments is Type A data. In this paper, we refer to this data collection as Type A data.
First, when collecting Type A data, use a standardized form to record the measurement results. This form will be customizable to the method or measurements you are currently working on. The example below shows a repeatability test for a pipette at 100 μL using ISO 8655 as the measurement method.
If you are taking Type A Data for Reproducibility, you only need to duplicate the repeatability form and have another technician take the same measurements using the same equipment setup. See the example below.
Another way to improve reproducibility is to send the pipette (in this case) to another lab and have them provide the Type A data they record. There are other ways as well. For example, if you only have 1 tech, you could have them perform this method twice on different days or with a different scale. Then you compare the data between the two. The point of reproducibility is to measure how consistent the method is when the technician changes, the performing lab changes, the day of calibration changes, or when another variable changes. It measures the method’s robustness.
There are ways to further investigate reproducibility beyond preparing uncertainty budgets, which we will get to next. Reproducibility between technicians and/or labs is an excellent way to assess whether the variance between the two runs is acceptable. It’s a great tool for assessing whether your method works consistently, regardless of who performs it. One way to check this is to run ANOVA in Excel with the Type A data from both technicians. This is not covered in this white paper because it could be the subject of a separate white paper. But this is an excellent tool for comparing performance between labs or technicians.
An uncertainty budget is a way to combine and organize all the contributors to your uncertainty. It is also a way to estimate the overall uncertainty of a measurement method by combining individual uncertainties. The uncertainty budget is really a template that should be used when evaluating uncertainty for all methods and measurements. The uncertainty budget is the best way to keep organized and calculate the uncertainty.
What is included in an uncertainty budget? Below is an example of an uncertainty budget that involves the following:
It’s important to note that this uncertainty budget will include contributions from the method used to calibrate pressure gauges. Every uncertainty budget will be unique, with its own contributors. This paper is not intended to give you an example of an uncertainty budget to copy; it’s intended to guide understanding of uncertainty and how labs are calculating the number on their reports.
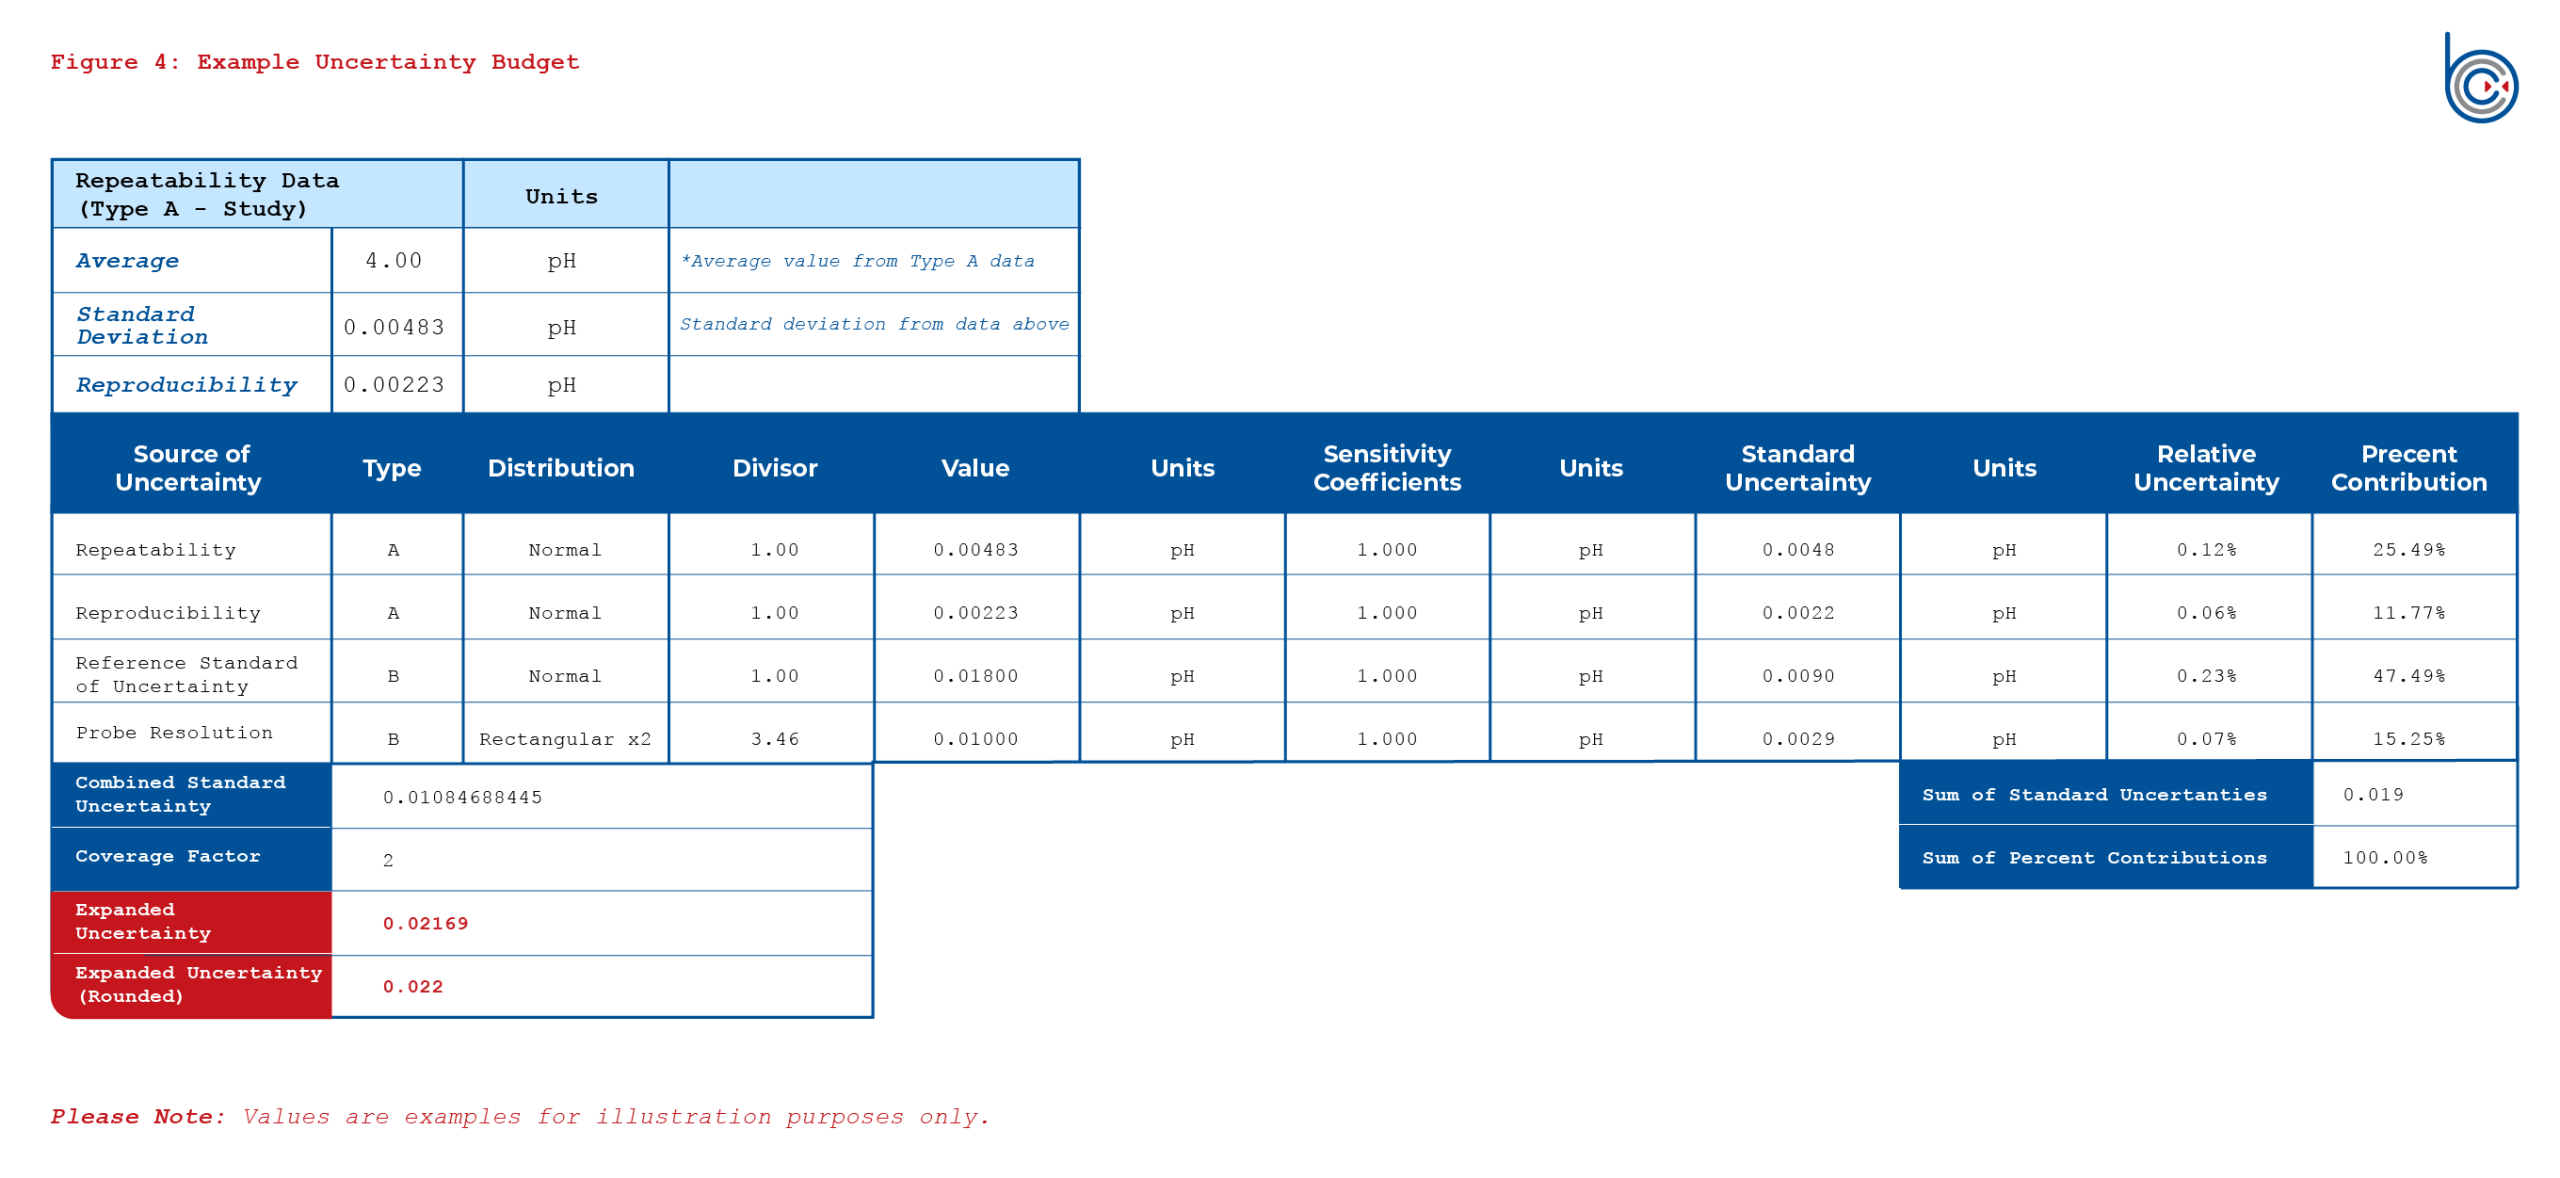
Let’s look at each column on the uncertainty budget and what it means.
Column 1 – Sources of Uncertainty
There are several sources of uncertainty in measurement, which can be broadly categorized into:
Identifying all sources of uncertainty is the first step in creating an uncertainty budget to estimate the total uncertainty of a calibration method. The best way to identify all sources of error or uncertainty is to start by getting organized. Creating a list of possible error types is a great first step. Following the steps outlined in this section can help you populate your list with all possible contributions to the error.
Column 2 – Type of the Source
The Type column indicates whether the source is a statistical analysis or a reference value. These are known as Type A and Type B contributors to uncertainty.
Column 3 – Distribution of the Source
The Distribution Column identifies how the value associated with the source is distributed. For example, Type A contributors usually have what’s called a normal distribution. It is normal because the value comes from data collected in the lab, and measurements typically follow a normal distribution. Other distributions can occur. For example, the uniform distribution is often used for sources that come from specification sheets, such as tolerance and resolution values, as well as other literature references.
Column 4 – Divisor
The divisor column is derived from the distribution column. If the distribution is normal, the value for the divisor is 1. Then the uncertainty value is divided by the divisor in the divisor column. Here is a table of values for divisors.
Column 5 – Value of Uncertainty Source (if applicable)
This column holds the actual numerical value of each uncertainty source you identified. For Type A sources, this value is derived from statistical analysis of your collected data, typically the standard deviation of your repeatability measurements. For Type B sources, this value is taken from the reference material, such as the accuracy specification on a calibration certificate, a tolerance from a manufacturer’s data sheet, or the instrument’s resolution.
The reason this column is marked “if applicable” is that not every source will have a value entered directly here. Some sources are calculated from other inputs, while others may not meaningfully contribute to the measurement and can be left blank. The goal is to capture the magnitude of each source in its original form before any conversion.
Column 6 – Units of Value
The units column records the unit of measurement for the value in Column 5. This is a critical column because uncertainty sources often come from different references and arrive in different units. For example, a temperature coefficient might be reported in degrees Celsius while your measurement result is reported in pH units or millivolts.
Keeping track of units here allows you to convert everything to a common unit later in the budget. Without consistent unit tracking, the values cannot be properly combined, and the final uncertainty estimate will be wrong. This column forces you to stay organized and account for every conversion that needs to happen.
Column 7 – Sensitivity Coefficients
The sensitivity coefficient describes how much the final measurement result changes when a particular uncertainty source changes. It is the link between a source measured in one unit and a measurement result reported in another unit. In many cases, the sensitivity coefficient is simply 1, which means the source already shares the same unit as the measurement result and no conversion is needed.
When the source and the result are in different units, the sensitivity coefficient converts the source to the units of the measurand. This coefficient often comes from the mathematical relationship within the measurement method, sometimes as a partial derivative of the measurement equation. It ensures that each source contributes to the total uncertainty in a way that reflects its real effect on the result.
Column 8 – Units of Sensitivity Coefficients
This column records the units of the sensitivity coefficient from Column 7. The units here are what allow the value of the uncertainty source to be converted into the units of the final measurement result. When the source value in Column 5 is multiplied by the sensitivity coefficient, the units must cancel correctly so that the result lands in the unit of the measurand.
Tracking these units is a check on your math. If the units do not resolve properly when you multiply the source value by its sensitivity coefficient, it indicates that something in the budget needs to be corrected before moving forward.
Column 9 – Standard Uncertainty (if applicable)
The standard uncertainty is the value of each source after it has been divided by its divisor and adjusted by its sensitivity coefficient. This is the column where all sources are brought into a common format so they can be combined. It represents each contributor expressed as a standard deviation in the units of the measurement result.
This step is where the budget pulls everything together. Each source starts in its own units and distribution, and after the divisor and sensitivity coefficient are applied, each source is expressed consistently. These standard uncertainty values are the ones that get combined to produce the total uncertainty at the bottom of the budget.
Column 10 – Units of Standard Uncertainty
This column lists the units for the standard uncertainty values in Column 9. At this point in the budget, every source should share the same unit because each one has been converted using its sensitivity coefficient. These units should match the unit of the measurement result being reported.
The purpose of this column is to confirm that the conversion worked. Once all standard uncertainties are expressed in the same unit, the values are ready to be combined. If any unit in this column does not match the others, that source has not been converted correctly, and the budget cannot be finished accurately.
Column 11 – Relative Uncertainty
Relative uncertainty expresses the standard uncertainty as a fraction or percentage of the measured value rather than as an absolute number. This is useful because it allows uncertainty to be compared across different measurement values and different methods. A relative uncertainty remains meaningful even when the measurement size changes.
This column is helpful when you want to understand the size of an uncertainty source in proportion to the measurement itself. It also makes it easier to compare the performance of a method across a range of values, since absolute uncertainty can grow or shrink depending on the magnitude of the measurement.
Column 12 – Percent Contribution for Source of Uncertainty
The percent contribution column shows each source’s contribution to the total combined uncertainty. It is calculated by comparing each source to the total, letting you see at a glance which sources dominate the budget and which are minor. This is one of the most useful columns for understanding the source of your uncertainty.
This column guides where to focus improvement efforts. If one source accounts for a large share of the total uncertainty, that is where attention should be focused to tighten the method or improve the equipment. Sources that contribute very little can usually be left alone, since reducing them will have almost no effect on the final result.
Next, Calculate the Total Combined Uncertainty Estimation
Once you have all your contributors filled out, and all the rows and columns are populated. You will want to take the RSS (Root Sum Square) of all the values in column 9 – the standard uncertainties. The root-sum-square will be the total estimated uncertainty. You then multiply this value by the coverage factor. See the next section.
Expressing Uncertainty
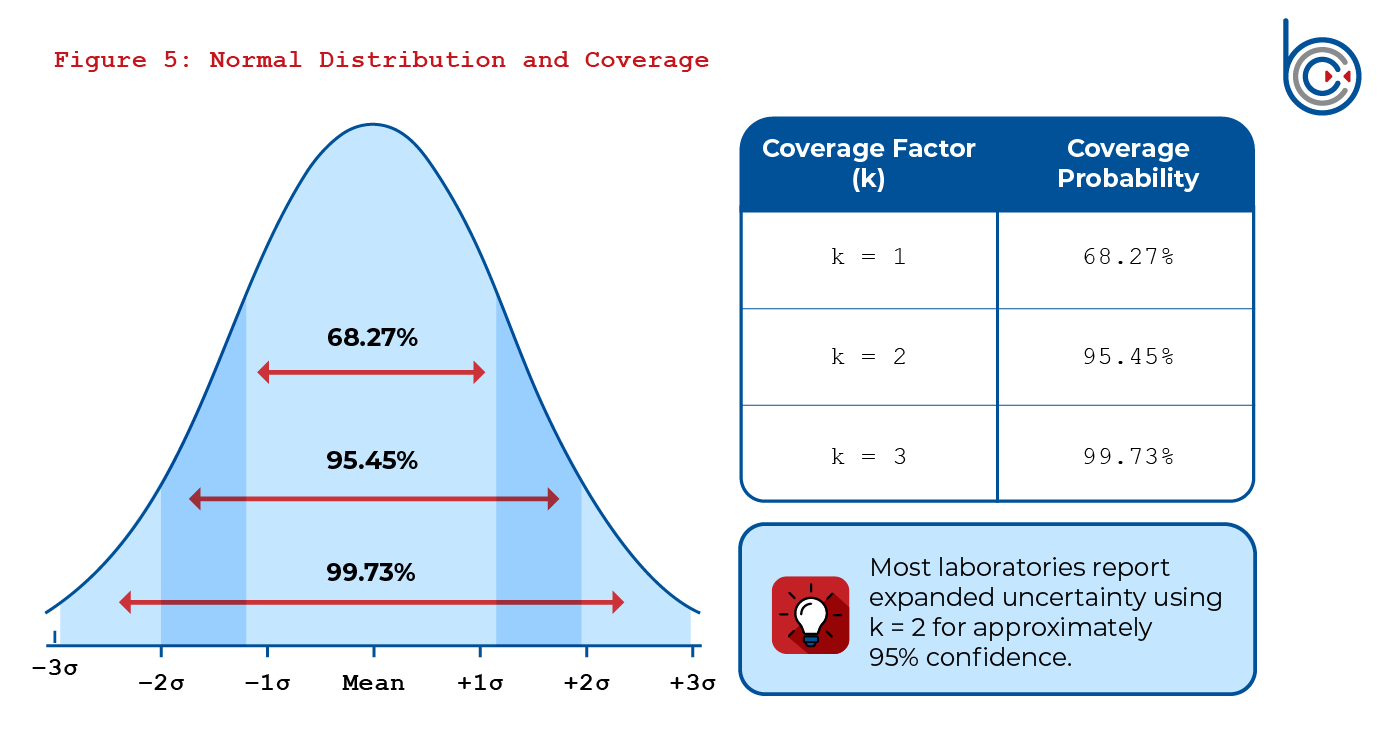
Uncertainty of measurement is typically expressed as a standard uncertainty, often represented as a standard deviation. For more comprehensive uncertainty, laboratories might report an expanded uncertainty, which is the standard uncertainty multiplied by a coverage factor (k), providing a higher confidence level (typically 95%).
Now that an uncertainty budget has been established for pH meter calibrations (as in the above example), we can use it to calculate the uncertainty for customer devices. The budget we already created is the framework and can be used to calculate the uncertainty for the customers’ pH meters. The only things that will be different are the repeatability and the standard solution uncertainty (if you are using a new solution at this time).
The reason we are updating these values is that the repeatability used in our original budget was likely based on a meter the lab owns to estimate CMC (Calibration and Measurement Capability) uncertainty. The CMC is an uncertainty value that labs calculate with their uncertainty budget to provide customers with an estimate of the uncertainty they can produce with their own equipment and controlled environment, or the best-case uncertainty value. That is different from the uncertainty they need to report to the customer, using the customer’s device and possibly the customer’s environmental conditions. So, the lab will have to take the repeatability data using the customer’s device, see how it performs, and add that new value to the uncertainty budget.
In this case, they will also most likely have to update the standard reference pH solution uncertainty. The reason is that the solution uncertainty used before is likely no longer the same solution. So, if the solution has been changed, the uncertainty value must be updated to match the solution used at the time of calibration. This is called the traceability uncertainty. This uncertainty makes the calibration measurement uncertainty traceable to the equipment and/or solutions used at the time of the calibration.
Once the values that need to be in the budget have been updated, the lab can then RSS the standard uncertainties. That value will be the updated uncertainty reported for that specific calibration.
Understanding measurement uncertainty is fundamental to the value of any calibration certificate. Throughout this paper, we have walked through the three main steps that produce a reported uncertainty value. First, the lab collects Type A data through repeatability and reproducibility studies. Second, the lab builds an uncertainty budget that organizes every contributor, both Type A and Type B, and converts each source into a common form so the values can be combined. Third, the lab uses that budget at the time of calibration to calculate the estimated uncertainty for a specific customer device by updating the repeatability and traceability values that apply to that measurement.
The uncertainty value on a certificate is not an arbitrary number. It is the result of a structured process that accounts for the instruments, the environment, the method, and the people performing the work. Each contributor is identified, quantified, assigned a distribution and a divisor, adjusted by its sensitivity coefficient, and then combined using a root-sum-square calculation before the coverage factor is applied to produce the expanded uncertainty.
For customers, knowing how this value is produced provides a clearer picture of what a calibration result actually represents. A reported uncertainty reflects a lab’s confidence in its measurements and allows results to be compared across labs, over time, and against international standards. Asking a calibration provider about their uncertainty budgets and how they arrive at the reported value is a reasonable and useful question. It demonstrates a deeper understanding of measurement quality and helps confirm that the provider operates to the standards expected of an ISO/IEC 17025:2017 accredited laboratory.
The goal of this paper was to give the reader the knowledge needed to understand the uncertainty value and the process behind it. With this understanding, customers and stakeholders can engage with their calibration providers with greater confidence and make better-informed decisions based on the results they receive.